

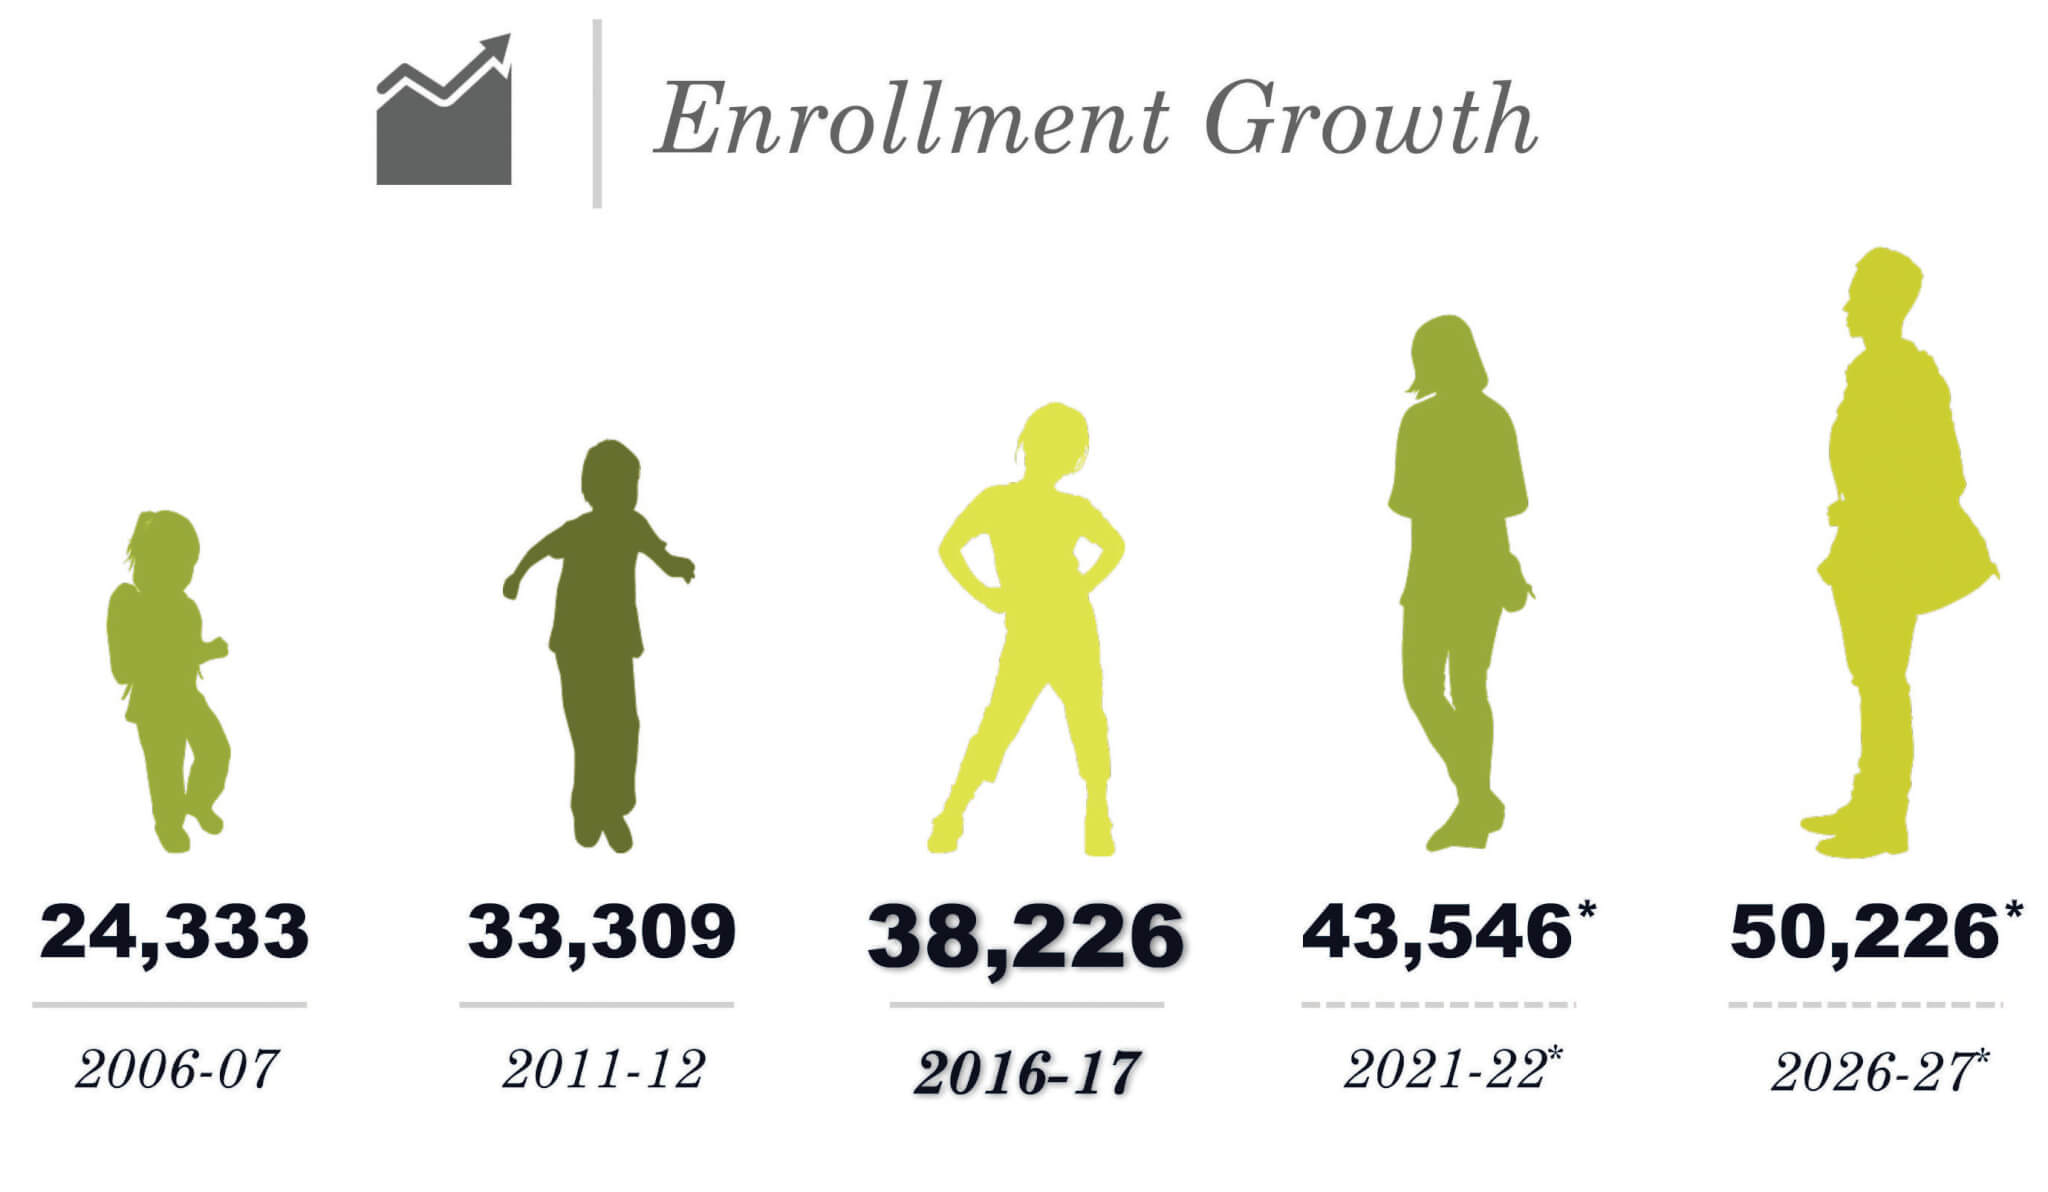
* Projected growth based on 2016 demographic report. Source: Leander ISD
Getting ready for enrollment,
Keeping academic scores high
By KIM ESTES
Four Points News
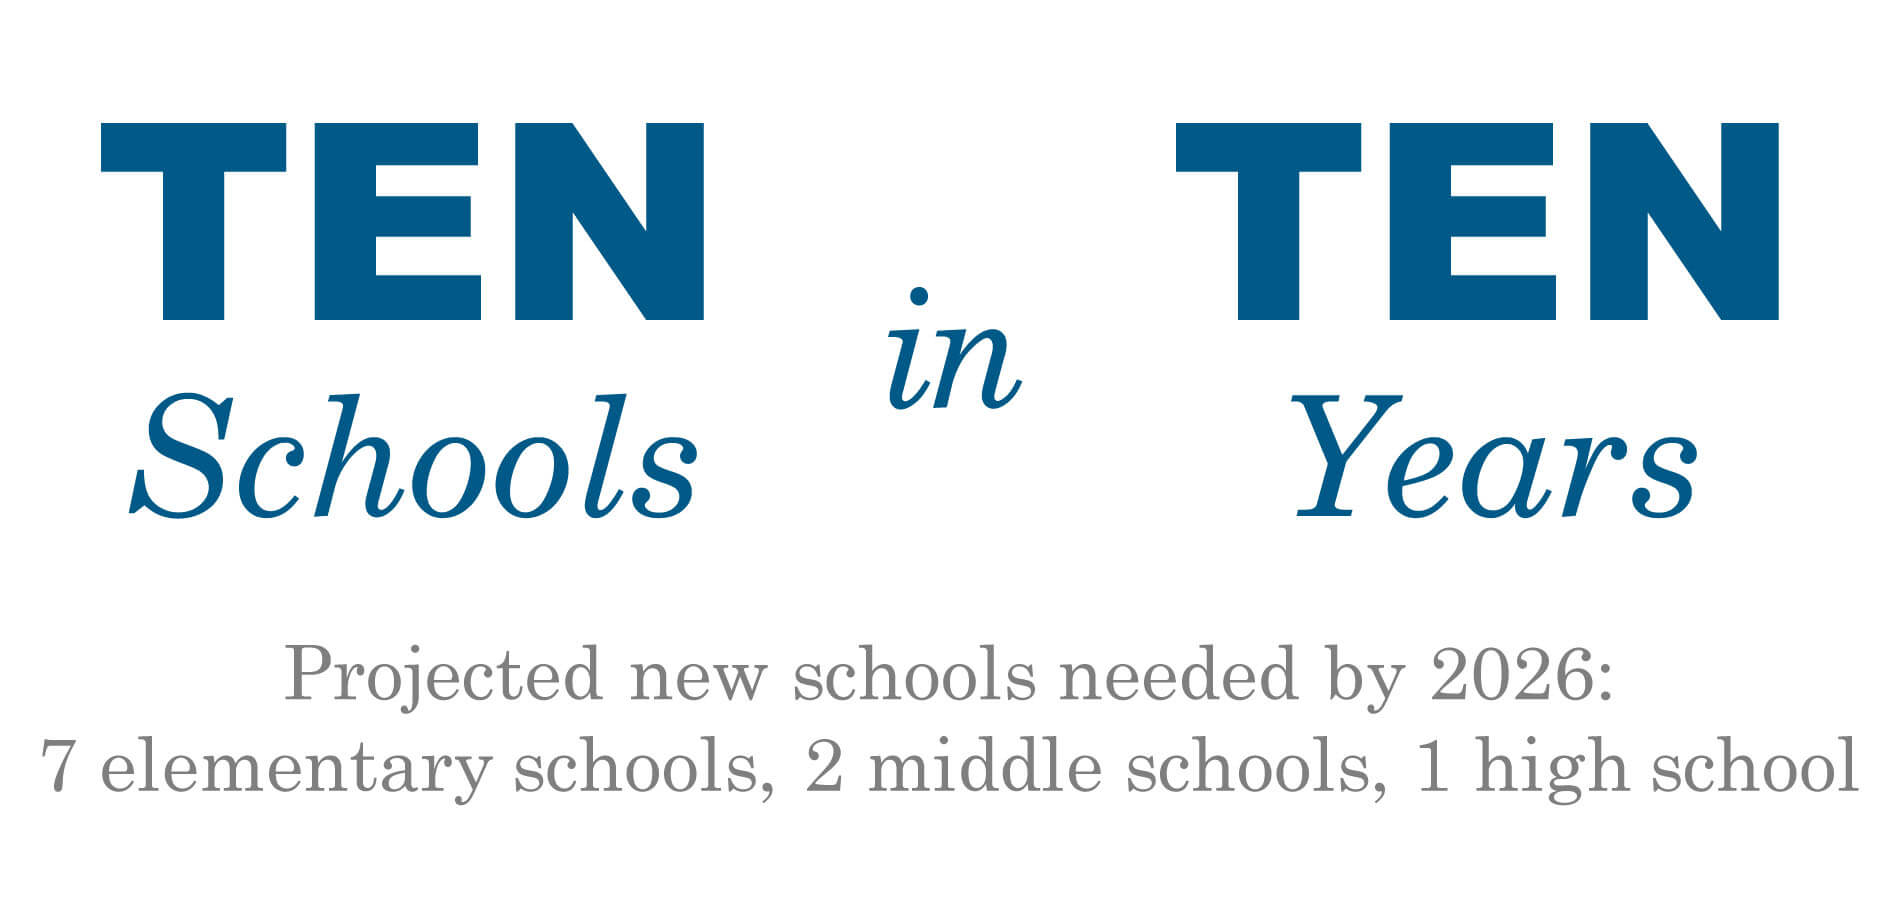
Superintendent Dan Troxell said Leander ISD needs 10 schools in 10 years to accommodate projected growth, which demographers say will include 12,000 more students by 2026.
Troxell was speaking to a crowd of 220 gathered on Friday at Hill Country Bible Church, Lakeline, for the annual LISD “State of the District” meeting sponsored by Leander ISD Educational Excellence Foundation.
In addition to discussing growth, Troxell gave a synopsis of the most recently available facts and figures on the district, including a breakdown of student population data, academic performance rates and the budget.
Preparing for student growth
Troxell said LISD is the 14th fastest growing district percentage-wise among more than 1,200 public school systems in Texas.
Enrollment has increased by about 1,200 students this school year to 38,226 compared to last. From 2012 to 2017, the student population has averaged an annual increase of 983.
Furthermore, demographers project a student population increase of 12,000 to a total of 50,226 students in 2026.
Estimates are based on new housing occupancy rates.
 Apartment construction and a proposed subdivision on Milky Way Drive have attracted prognosticator attention to Steiner Ranch and River Place. However, most of the increase is expected in the northern part of the district, said Troxell.
To serve these additional students, LISD will require 10 more schools, including seven elementary schools, two middle schools and one high school, said Troxell.
Officials have announced the formation of a bond advisory committee to study and develop recommendations on the matter.
Academics continue to be strong
In the area of academic performance, LISD exceeded statewide STARR/End-of-Course passing rates in science/social studies – 86 percent to 77 percent, math – 85 percent to 73 percent and in English/reading/writing – 84 percent to 71 percent.
However, scores also showed that economically disadvantaged students did not fare well as a group, having achieved an overall average of 67 percent; the state overall average was 65 percent.
Economically disadvantaged is defined as a family of four on the free lunch program with an income of $30,000 or less a year. Nineteen percent, or 7,233 LISD students, are in this group.
The aforementioned testing result was the subject of the only two questions publicly directed to Troxell at the end of Friday’s meeting.
Responding to the first question, Troxell said to correct this proficiency gap the district is taking a multi-faceted approach.
The first thing is to bring affected students up to grade level in reading. “If kids can read they can do well,” he said.
Currently, 79 percent of LISD students read at or above grade level by the third grade.
The next step is to correctly identify academic needs versus socio-emotional needs. For this, the district has provided educators a new tool to measure student progress and better distinguish between academic and socio-emotional needs, for which the district will look for other resources, such as counselors and mentors, Troxell said.
And finally, the district hopes to involve all students in a variety of programs. “When kids are involved, they do better. There’s no doubt about that,” Troxell said.
In answer to the second question, Troxell said demographers believe LISD’s economically disadvantaged population rate will hold steady for the next few years. He believes that is due to the cost of local housing.
Statewide, the number of economically disadvantaged students increases by one percentage point every year, he said.
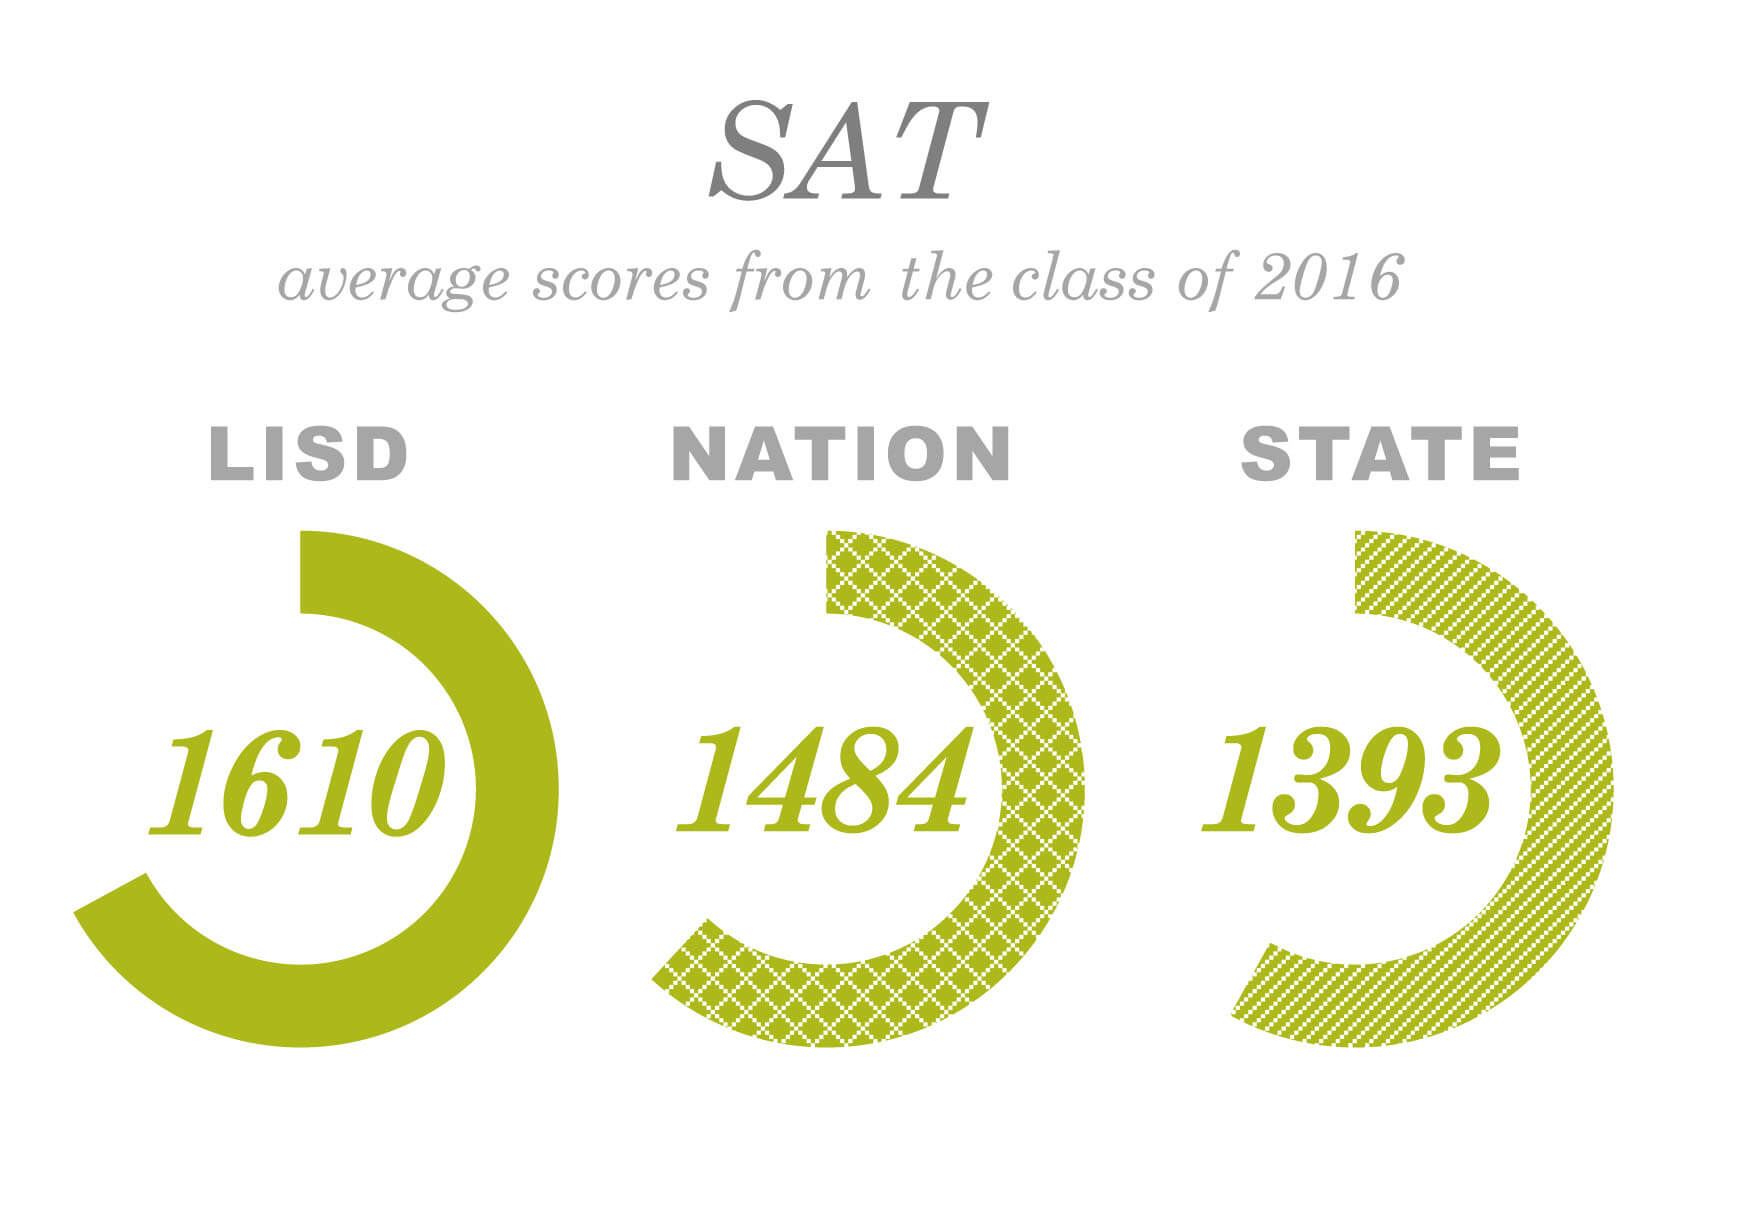
In other performance related information, Troxell reported that the average score of the class of 2016 on SAT testing was 1610 compared to a national average of 1484 and a state average of 1393.
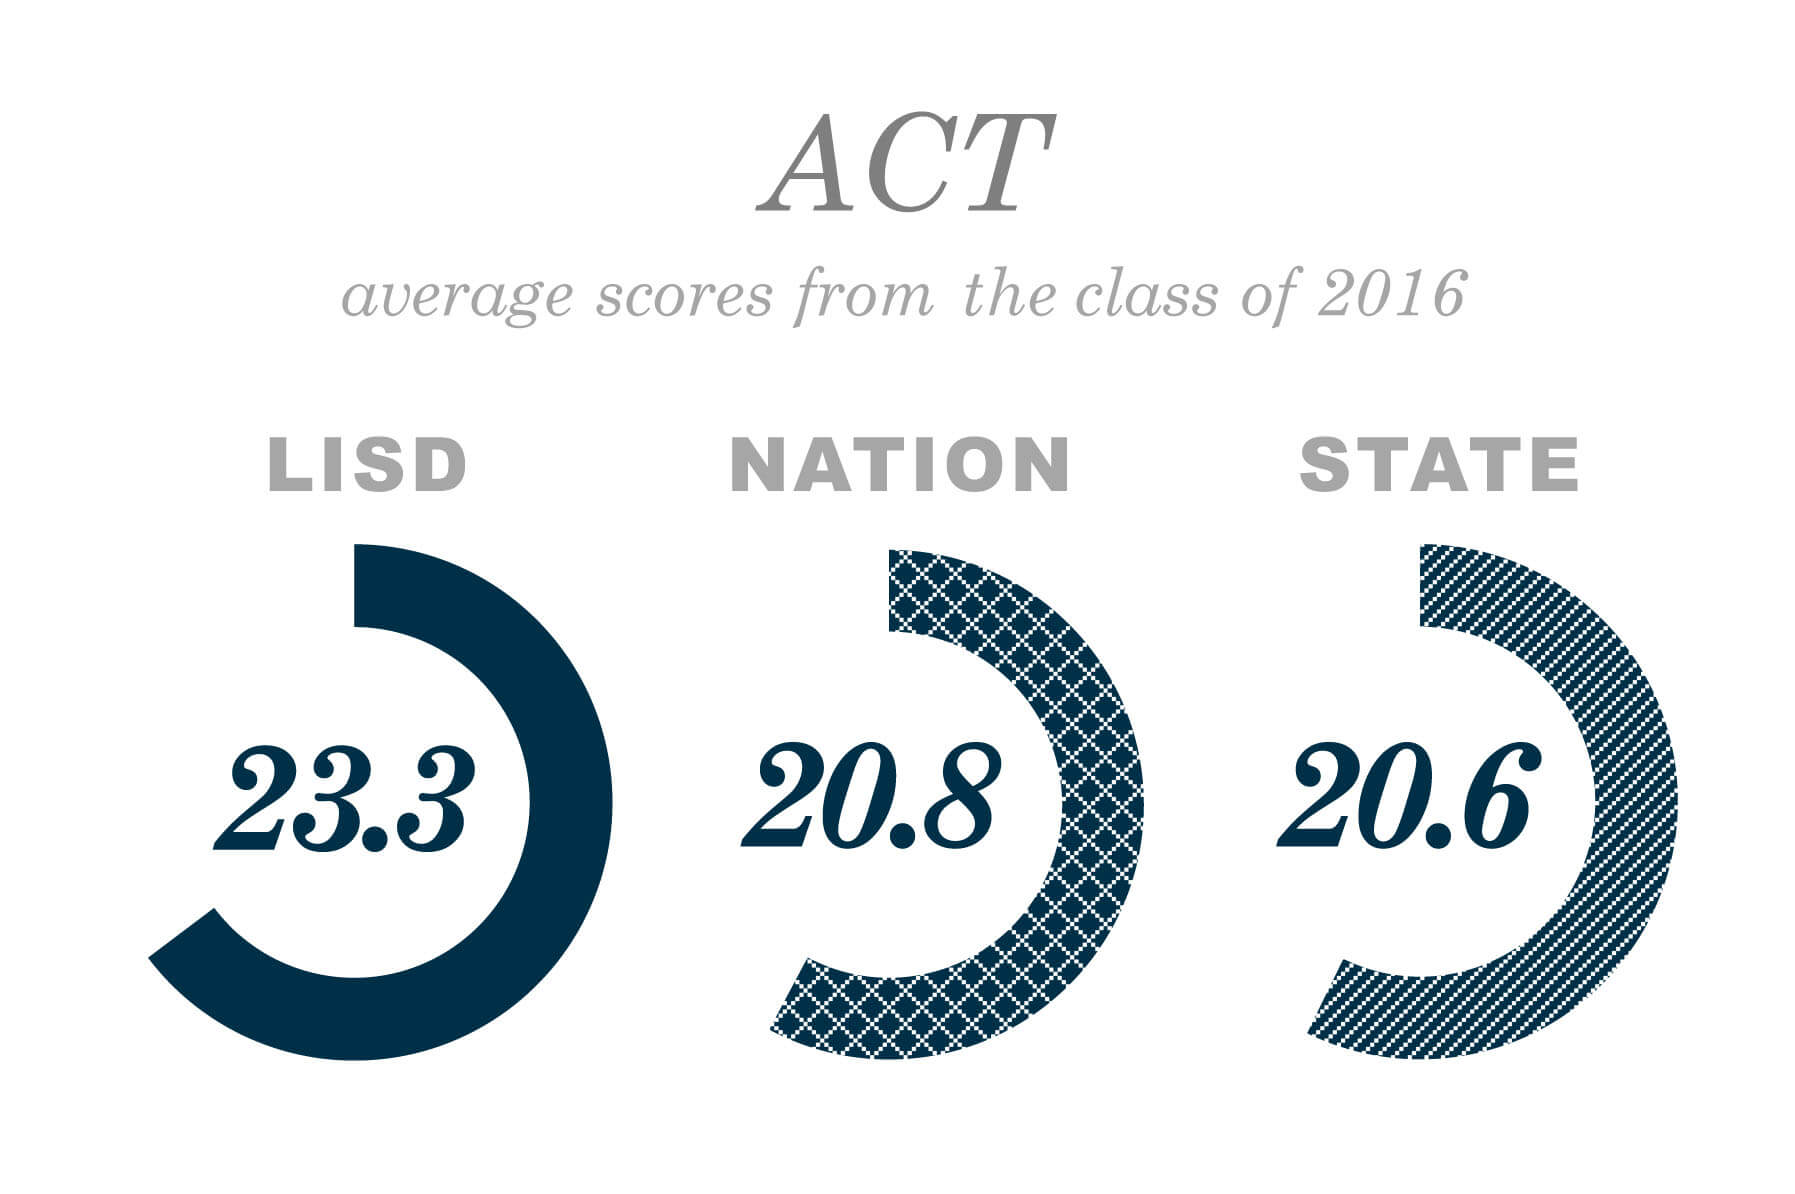
For the ACT, seniors averaged a score of 23.3, beating national and state averages of 20.8 and 20.6, respectively.
 Finally, of 3,875 students who took Advanced Placement Exams in 2015-2016, 71 percent earned college credit. Also, 1,426 students enrolled in dual credit courses to earn an average of 7.3 college credit hours per student.
To see a copy of the 2017 State of the District report, go to www.leanderisd.org/default.aspx?name=abt.sotd
Next week, Four Points News will cover more of the State of the District report including making sense of educational dollars.