
By CHRIS RAMSER, Austin Chamber
Austin ranks first among the top 50 largest metros for new residents as a percent of total population.
According to the U.S. Census Bureau’s decennial census 2020, the Austin metro was the fastest growing of the top 100 U.S. metros from 2010 to 2020, adding 567,082 people and growing at a rate of 33%.
The Austin metro area gains about 33,700 people annually from domestic migration, 6,660 from international migration, and 15,980 from natural increase (births minus deaths).
The greatest source of new migrants to the Austin metro is other parts of Texas, although the average annual number of new residents from elsewhere in Texas has decreased and the number from California and New York has increased over the last five years.
The most significant metro area contributors to Austin’s annual growth are Houston, Dallas, San Antonio, Los Angeles, and New York.
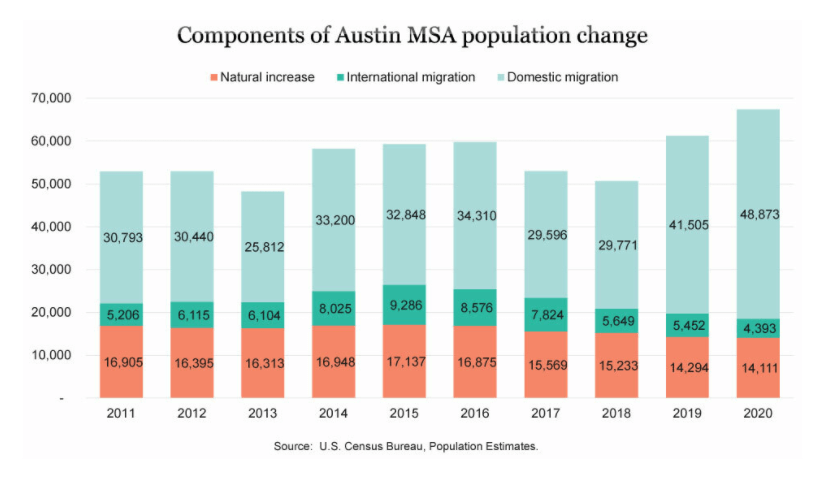
Since the beginning of the decade, the Austin metropolitan statistical area has grown by an average of 56,800 people annually, according to the U.S. Census Bureau’s population estimates program. Much of this growth is attributable to net domestic migration, roughly 59%, with another 12% due to net international migration, and 28% from natural increase.
Domestic migration in the last two years of the decade increased dramatically to 41,505 in 2019 and 48,873 in 2020, far surpassing the decade average of 33,714 people annually.
Austin ranks first among the top 50 largest metros for new residents as a percent of total population. Between 2010 and 2020, Austin added 403,778 net new migrants, or 18% of its total 2020 population. Orlando came in second with 15% and Raleigh was third with 14% of their current population attributed to net migration. San Antonio also made the top 10 with net migration since 2010 accounting for 11% of the metro’s total population. Dallas and Houston rank 11th and 14th with 10% and 9%, respectively. Across all U.S. metros, net migration since 2010 accounts for 3% of 2020 population.
The Austin region’s annual growth from 2019 to 2020, as calculated from the Census Bureau’s population estimates, was 67,197 or 184 persons per day. Of this daily number, net migration accounts for 146, and 39 are the result of births exceeding deaths.
Additional insights into migration are provided by the Census Bureau’s American Community Survey (ACS). This annual sample survey, the replacement for the Decennial Census’s “long form” questionnaire, instituted following the 2000 Census, provides data on many demographic, economic, social, and housing characteristics of U.S. residents.
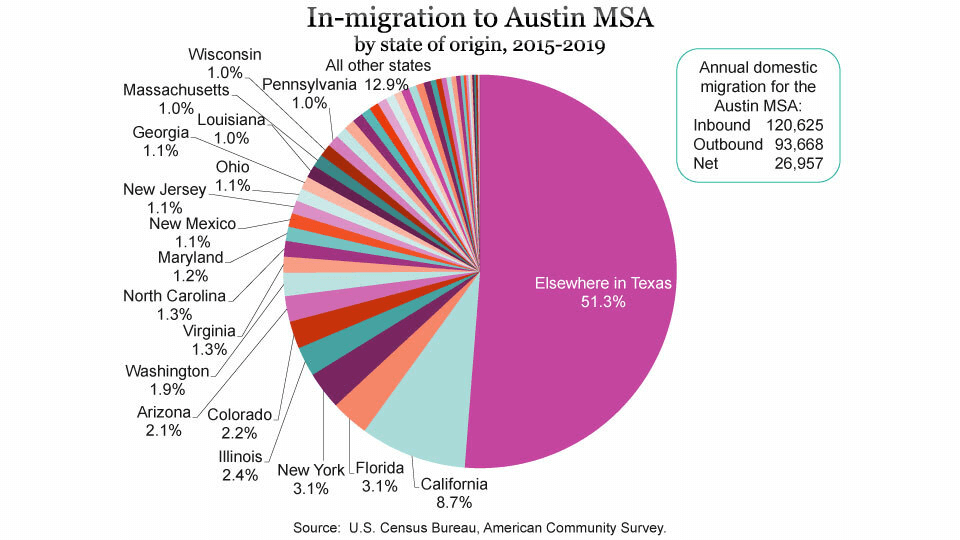
Data downloaded from the American Community Survey’s Census Flows Mapper shows inbound and outbound flows, as well as net migrants, from a selected county to all other counties in the U.S. and Puerto Rico. Using the metro area aggregated tables, the Austin region received 120,625 domestic inbound migrants, and sent 93,668 outbound migrants to other places, resulting in net migration of 26,957.
Austin’s inbound flow was dominated by people arriving from other counties in Texas (51%), followed by California (9%), Florida (3%), New York (3%), and Illinois (2%). Each state that contributed at least 1% of inbound migrants to Austin MSA are labeled in the pie chart (on page 1). All other states contributed 12.9% of the inbound total.
In-migration to the Austin region exceeded out-migration for 31 states, while Austin saw slight deficit flows with 20 states and the District of Columbia—that is, more Austinites departing to than coming from these states.
Three states, excluding Texas with 10,476, contributed over 1,000 net migrants each year to Austin, including California (5,951), New York (1,887), and Illinois (1,517) with another eight states contributing over 500 net migrants a year (New Mexico, 893; Ohio, 744; New Jersey, 730; Wisconsin, 688; Florida, 657; Maryland, 602; Minnesota, 563; and Massachusetts, 529.
The states that gained the most residents from Austin were Nevada (-314), Connecticut (-292), Oregon (-291), Oklahoma (-263), and Washington, DC (-245).
Since the information for this release is collected through a sample survey, it is possible that some of the states with smaller net migration totals could be within the margin of error for these estimates, meaning it is impossible to tell if the state’s net migration was actually a deficit or positive flow.
Chris Ramser is a researcher with the Austin Chamber of Commerce.